Unlike the Mendix built-in Reports which uses OQL queries, the ChartJS modules gets its data from a microflow. The first thing you need to do is make an entity model that looks something like this
https://github.com/mendix/ChartJS/blob/master/assets/multiseries_datamodel.png
So create your entities and then fill in all the attributes, you might want to put them in a separate module.
Then you can build your datasource microflow. In this microflow you need to retrieve data from your database (probably using XPath) and reformat it, by creating Datapoint objects with correct values. After you have all your DataPoint Objects you need to associate them with the correct Dataset object (in some cases you only need 1 Dataset object). The names can be a bit confusing but a data point is a single point on the graph, and a dataset is set of points that belong together and have the same label and color.
Finally, you need to create 1 Chart object, associate it with all Dataset objects and return this as result in the microflow.
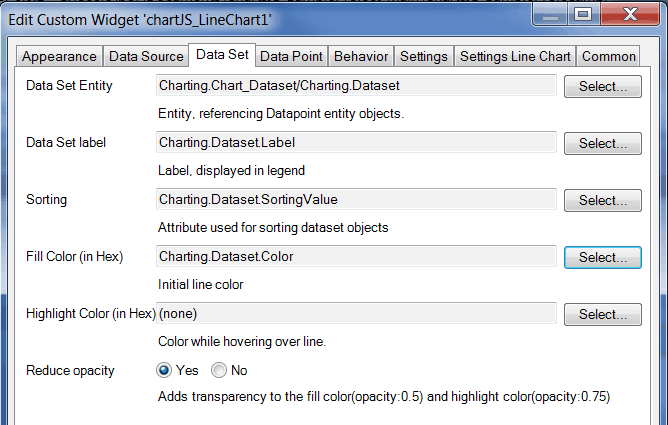
With all this in place, you just need to set which microflow to use as datasource in the widget (double clicking on it, and then go to tab DataSource).
https://www.mendix.com/wp-content/uploads/dataset2.png
Here are two additional more in depth user-guides:
https://www.mendix.com/blog/turning-data-intelligence-chartsjs/
Venkat. the described solution of Andrej would not work without turning the image into png.
I am doing exact the same with Jfree, which is a Mendix app store module turning graphs into png's so you can include in your document generation.
I think that is your solution.
Hi Venkat,
Hope the following sample helps you to achieve the chartJs report. https://appstore.home.mendix.com/link/app/58677/Tammina-Solutions/Mendix-Graphical-Reporting